FUTURE RAINFALL VARIABILITY IN MESOSCALE CONVECTIVE SYSTEMS
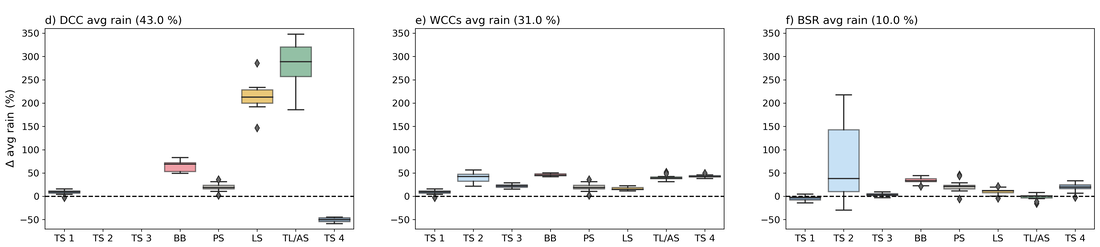
Using ensembles of convection-permitting simulations to simulate MCSs in a current and future climate in the Central U.S., we show that rainfall increases in MCSs are mainly driven by convective rather than stratiform rainfall. The variability in ensemble members is largest for isolated deep convection and smallest (i.e., most robust) for wide convective regions in the MCS, highlighting where the greatest confidence for future changes are.
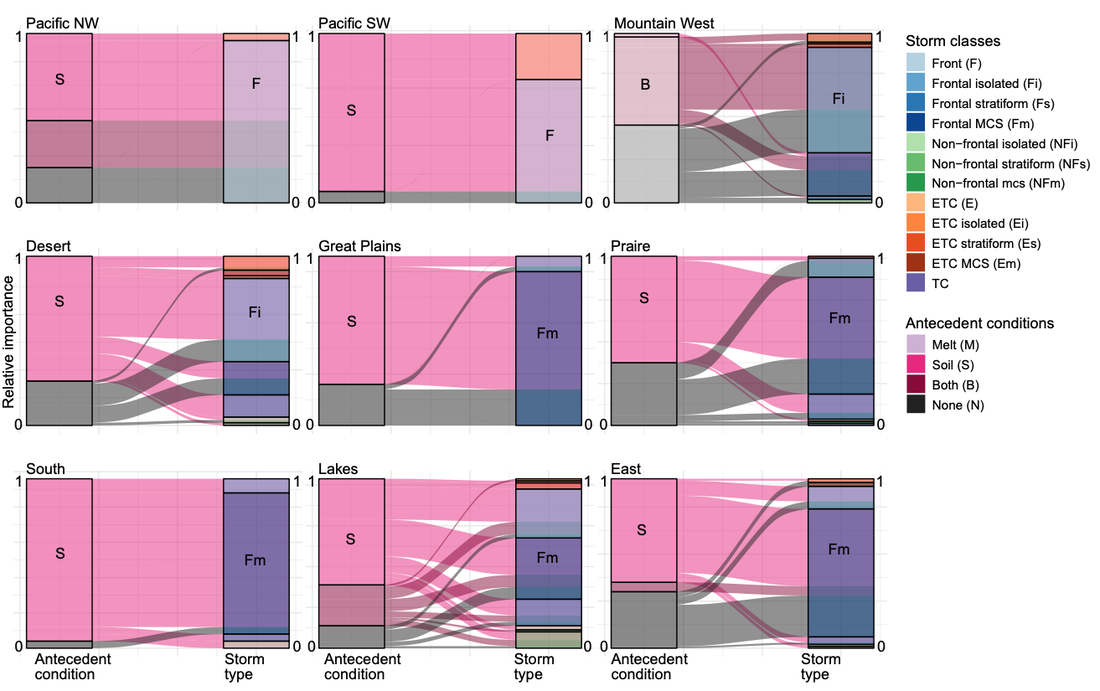
storm types and antedecent conditions influence on floods
Based on a storm type algorithm (see on Github) and antecedent surface conditions, we find that frontally forced rainfall (particularly frontally forced MCSs), combine with wet soil moisture to produce regional floods.
CHANGES TO FLASH FLOOD-PRODUCING STORMS IN A WARMER CLIMATE
Using the flood-climatology below along with convective-permitting simulations of a current and future climate, I examined how these storms will change in a warmer, moister climate in the continental U.S., the Missisippi River Basin, and California.
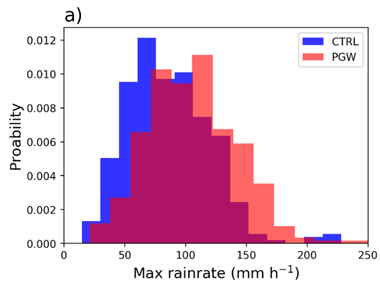
U.S.-WIDEMaximum rain rates increase in a warmer climate over the U.S. as seen by a shift in the PGW (red color) distribution.
|
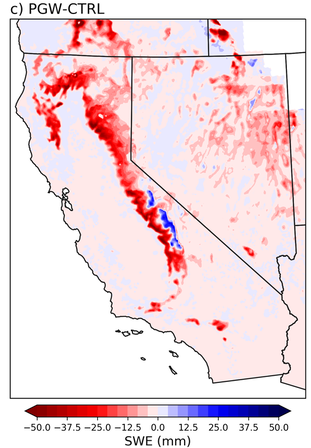
californiaSWE decreases (red) in a warmer climate in atmospheric river-producing floods, except at the highest elevation sites where it increases (blue).
|
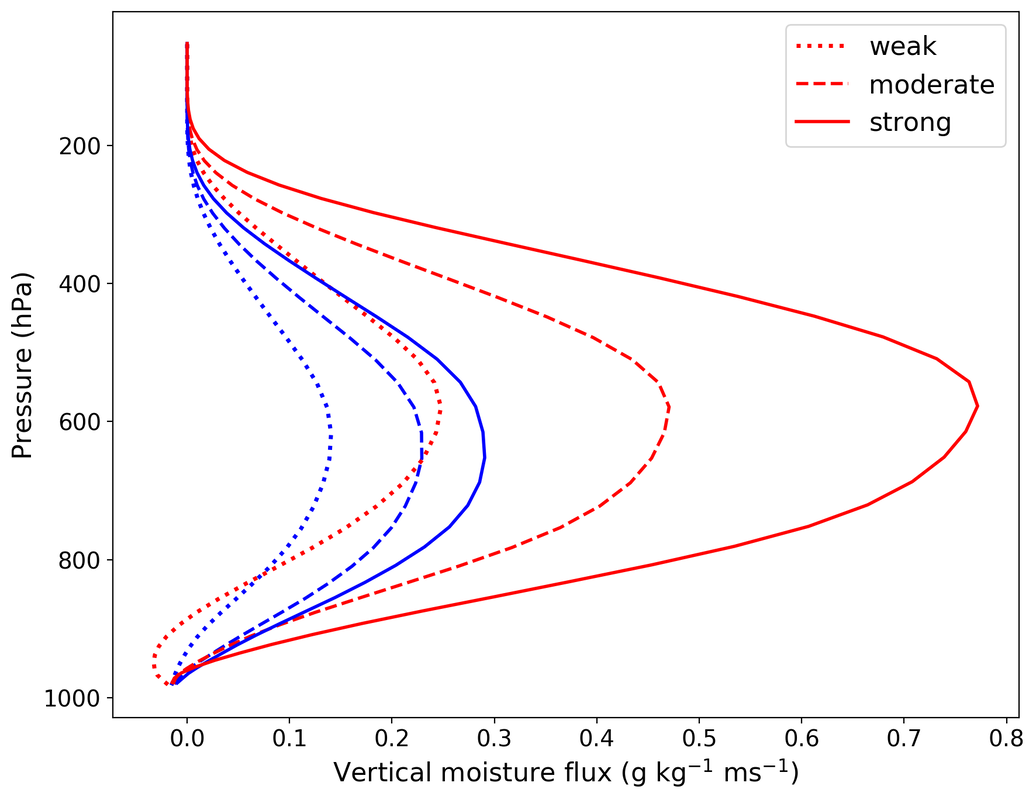
MISSISSIPPI RIVER BASINVertical moisture flux increases the most in a warmer climate in storms with stronger vertical velocity (solid) due to a greater strengthening of updrafts.
|
FLOOD-PRODUCING STORM CLIMATOLOGY
As part of my PhD research, I created a climatology of flood-producing storms from 2002–2013 over the continental U.S.. This dataset merges NCEI Storm Report data with flooded stream gages from Shen et al. (2017) and hourly Stage-IV precipitation data to document the meteorolgoical systems and their rainfall associated with a notable hydrologic response.
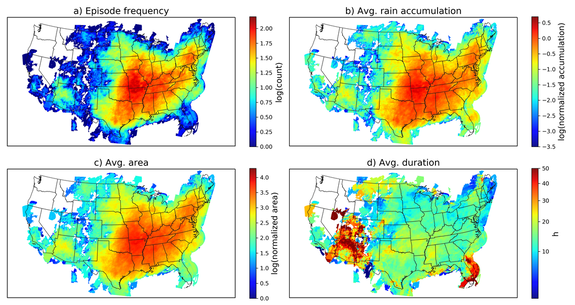
Stage-IV precipitation characteristics in 2808 flash flood-producing storm episodes from 2002-2013. The number of storms per grid cell are shown in a), the average rainfall accumulation per storm is in b), the average rainfall area is in c), and the average rainfall duration is in d). Note that a)-c) are on log normalized scales.
|
DATASET AVAILABLE UPON REQUESTPlease cite Dougherty and Rasmussen (2019) if using in research:
Dougherty, E., and K. L. Rasmussen, 2019: Climatology of flood- producing storms and their associated rainfall characteristics in the United States. Mon. Wea. Rev., 147, 3861–3877, https:// doi.org/10.1175/MWR-D-19-0020.1. |
